

The US midterm elections take place on November 3, 2026. While elections attract considerable investor attention, it is less clear how much they affect short-term stock market returns.
To investigate, I study daily US equity market returns from 1926 through 2025, comparing market performance around midterm elections with presidential election years and odd-numbered years.
The results suggest that US equities have historically performed particularly well around midterm elections, with roughly three-quarters of the outperformance relative to other years occurring before Election Day.
Market Returns Around November Elections
Figure 1 shows cumulative market returns over a 42-day trading-session window centered on the November election date. The window includes 21 returns ending at the last trading close before the election and 21 subsequent returns.
For each year, returns are aligned around the first Tuesday after the first Monday in November. The analysis covers 25 midterm elections, 25 presidential elections, and 50 odd-numbered years. The latter provide a comparison for the usual seasonal pattern around early November.
Historical returns are based on the CRSP value-weighted US stock market portfolio, obtained from the Kenneth R. French Data Library.
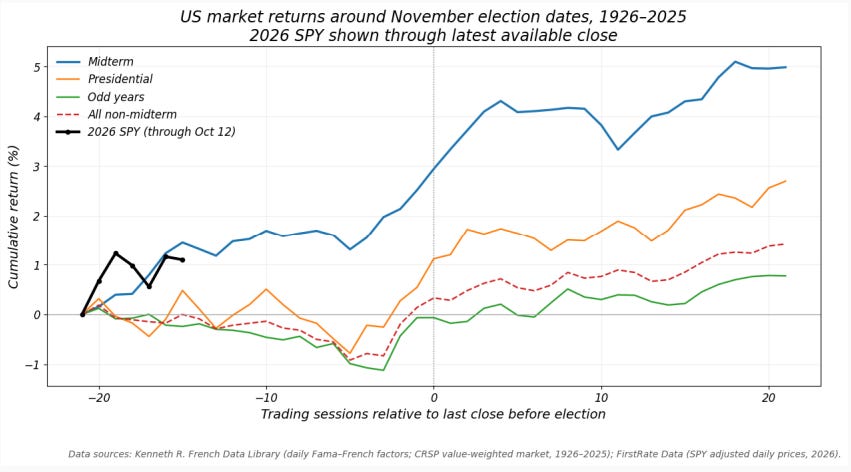
Figure 1. Cumulative US stock market returns around November elections, 1926–2025
The historical midterm pattern is distinct. Over the full event window, the market has generally delivered stronger returns in midterm election years than in other years. Much of this relative strength is concentrated in the weeks leading up to Election Day.
The chart also includes SPY’s performance in 2026. From the October 2 baseline through October 12, SPY has gained 1.10%, compared with approximately 1.45% for the historical midterm average at the same point in the election window.
How Large Is the Midterm Effect?
Table 1 reports average compounded returns for the 21 sessions before the election, the 21 subsequent sessions, and the full 42-session window.

Table 1. Average US stock market returns around November elections, 1926–2025 (%). Returns are arithmetic averages of individually compounded event-window returns.
The average 42-session return around midterm elections is 4.96%, compared with 1.37% in all other years. The difference of 3.59 percentage points is statistically significant using a two-sided Welch t-test (p = 0.041).
Midterm years also outperform odd-numbered years by 4.18 percentage points (p = 0.029). However, the difference relative to presidential election years is smaller and not statistically significant (p = 0.233).
The pre/post breakdown is particularly informative. During midterm years, the market has gained an average of 2.98% before the election and 1.96% afterward. By comparison, the average pre-election return in non-midterm years is just 0.29%.
This suggests that the historical midterm effect is not simply a post-election rally. A substantial part of the relative strength has occurred before the election itself.
Because all observations are aligned around the same November calendar dates, the comparisons also help distinguish the midterm pattern from ordinary autumn seasonality.
How Consistent Is the Pattern?
Figure 2 shows the compounded 42-session return around each midterm election from 1926 through 2022.
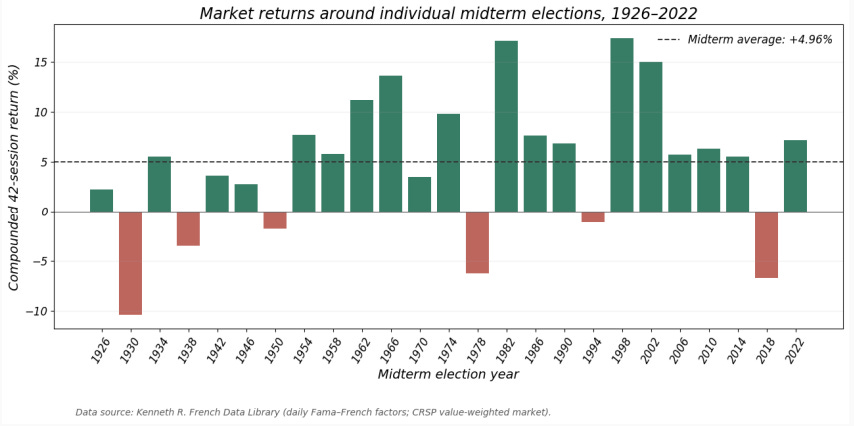
Figure 2. US stock market returns around individual midterm elections, 1926–2022
The market generated positive returns in 19 of the 25 midterm election windows, equivalent to 76% of observations. The pattern is also visible in more recent decades: Since 1982, 9 of the 11 midterm election windows have produced positive returns, with 1994 and 2018 being the exceptions.
However, the magnitude of returns varies considerably across elections, and some periods have produced losses. The historical average is therefore not representative of every election cycle.
The relatively small number of midterm observations is another limitation. Although the sample spans a century, it contains only 25 midterm elections, and the estimated average can be influenced by unusually strong or weak market episodes.
Why Might Markets Behave Differently Around Elections?
One possible explanation is the gradual resolution of political uncertainty. As Election Day approaches, polls and forecasts provide investors with additional information about likely outcomes, potentially reducing uncertainty and supporting risk appetite.
The concentration of returns before the election is consistent with this interpretation. A similar pre-announcement return pattern has been documented around scheduled macroeconomic events, including FOMC announcements.
More broadly, political-cycle effects, changing fiscal policy expectations, monetary conditions, and investor sentiment may also contribute to the observed return differences.
The analysis documents historical patterns rather than identifying their underlying causes. In particular, it does not establish a causal relationship between declining political uncertainty and stock market returns.
Implications for Investors
The historical evidence indicates that US equities have tended to deliver stronger returns around midterm elections than around other November dates. The effect is particularly pronounced in the weeks leading up to Election Day, while the post-election period has also generated positive average returns.
Although the pattern has been reasonably consistent across individual elections, it should be interpreted as a historical seasonal tendency rather than a standalone market-timing signal. Economic conditions, monetary policy, valuations, and the prevailing market trend are likely to matter more for the outcome of any individual election year.
The main finding is that the historical midterm election effect is primarily a pre-election phenomenon, with roughly three-quarters of the outperformance relative to other years occurring before Election Day.
The 2026 SPY comparison provides an opportunity to follow how the current election period develops relative to this historical pattern.
I’ll continue updating the comparison as we approach November 3.
Data and methodology: Historical daily market returns are constructed from the Fama–French daily factors (Mkt-RF + RF), representing the CRSP value-weighted US stock market. The sample covers 1926–2025. Returns are aligned around the first Tuesday after the first Monday in November. The event window includes 21 trading-session returns ending at the last close before the election and 21 subsequent returns. The cumulative-return chart compounds the cross-year arithmetic average daily return, while Table 1 and Figure 2 use compounded returns calculated separately for each year. The 2026 overlay uses SPY adjusted daily closing prices from FirstRate Data.
Disclaimer: This newsletter is for informational and educational purposes only and should not be construed as investment advice. The author does not endorse or recommend any specific securities or investments. While information is gathered from sources believed to be reliable, there is no guarantee of its accuracy, completeness, or correctness.
This content does not constitute personalized financial, legal, or investment advice and may not be suitable for your individual circumstances. Investing carries risks, and past performance does not guarantee future results. The author and affiliates may hold positions in securities discussed, and these holdings may change at any time without prior notification.
The author is not affiliated with, sponsored by, or endorsed by any of the companies, organizations, or entities mentioned in this newsletter. Any references to specific companies or entities are for informational purposes only.
The brief summaries and descriptions of research papers and articles provided in this newsletter should not be considered definitive or comprehensive representations of the original works. Readers are encouraged to refer to the original sources for complete and authoritative information.
This newsletter may contain links to external websites and resources. The inclusion of these links does not imply endorsement of the content, products, services, or views expressed on these third-party sites. The author is not responsible for the accuracy, legality, or content of external sites or for that of any subsequent links. Users access these links at their own risk.
The author assumes no liability for losses or damages arising from the use of this content. By accessing, reading, or using this newsletter, you acknowledge and agree to the terms outlined in this disclaimer.
Paid subscriptions may not be available in all jurisdictions and may change without notice.