
Market Timing with Macro Surveys
Reducing Equity Exposure Around Recessions

Introduction
Hi there. In recent months, there has been increased chatter about the possibility of a recession triggered by President Trump’s tariff war. The recent pause in tariffs appears to have eased some of those concerns. For example, JP Morgan now sees the likelihood of a U.S. recession to be below 50%, and the recession odds on Polymarket currently hover around 40%.
For investors, recessions are notoriously difficult to time, and they are typically announced only after the fact, making official recession declarations of limited use for market timing. Prior research has explored early-warning signals such as the yield curve or credit growth, but these indicators can be noisy or lagging. Rather than relying on individual macro signals, a growing literature on economic nowcasting has shown promise in aggregating real-time macro data to track economic conditions and anticipate downturns.
Nowcasting, however, comes with its own challenges, such as infrequent data updates, revisions, and noise. For example, Beber et al. (2015) present a straightforward method for obtaining real-time estimates of inflation, growth, and sentiment from a broad set of macroeconomic releases. More recently, Jain (2022) discusses the application of machine learning and alternative data to macro nowcasting. See also the recent contribution by Kislitskiy et al. (2025) on nowcasting U.S. GDP.
An interesting paper by Gomez-Cram (2022) finds that stock markets are slow to incorporate the onset of recessions, as investors tend to underreact to deteriorating macroeconomic conditions. This delay leads to several months of negative equity returns after a recession begins. The paper proposes a dynamic market timing strategy that reduces equity exposure when expected returns decline, typically during early recession phases, and reallocates to cash. This approach improves Sharpe ratios by approximately 30% compared to a standard buy-and-hold strategy.
Recession Beliefs
In a recent paper, Sun (2025) uses recession beliefs from the Survey of Professional Forecasters (SPF) to time equity and bond allocations. Using quarterly data from 1982 to 2024, the paper finds that SPF recession probabilities help predict NBER recessions one or more quarters in advance and can be used to shift out of a traditional 60/40 portfolio into bonds or cash.
For example, switching from a 60/40 portfolio to bonds based on SPF signals improves the Sharpe ratio from 0.74 to 0.95, a 28% improvement, and significantly reduces maximum drawdowns. The SPF-based signals are also compared with other common indicators such as consumer sentiment surveys and alternative SPF forecasts. Across all comparisons, recession beliefs emerge as the most consistent and effective signals for both recession forecasting and portfolio allocation.
Testing a Market Timing Strategy
Average Recession Beliefs
I test a variant of these findings by implementing a simple market timing strategy that switches between SPY and TLT, using ETF data obtained from EODHD. Since SPY data begins in 1993 and TLT only starts in 2002, I assume the strategy switches to the risk-free rate (cash) before 2002. I source the SPF recession beliefs (Mean Responses) from the Survey of Professional Forecasters, provided by the Federal Reserve Bank of Philadelphia. These beliefs reflect the “Probability that real GNP/GDP will decline (quarter over quarter) in the quarter in which the survey was conducted (RECESS1) and the following four quarters (RECESS2 to RECESS5).”
The survey is conducted quarterly, with the response deadline and release date typically falling in the second month of each quarter. For example, the recession probabilities reported since early 2024 are as follows:
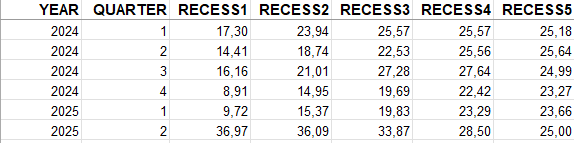
The latest data was released on May 16 and shows a sharp increase in recession probabilities, with the estimated probability for the next quarter (Q3 2025) rising to 36.09%. Following the approach in Sun (2025), I define the recession signal as the change in recession probabilities for the upcoming quarter:
Recession Signal: (RECESS2 - Lagged RECESS3) > 0
In the example above, the last signal would be 36.09 - 19.83, which exceeds zero. The market timing rule switches out of stocks whenever the signal exceeds zero.
Dispersion of Recession Beliefs
In addition to the level of recession beliefs, I also test a timing signal based on the dispersion of those beliefs. While this dimension is not explored in Sun (2025), prior research has shown that increased uncertainty or disagreement among investors often signals weaker near-term market performance. To compute dispersion, I use the Individual Responses dataset from the same source. This dataset provides recession probability forecasts for each participant (ID) across various horizons. An excerpt is shown below.
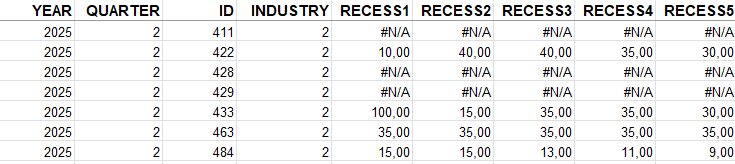
I define the dispersion of beliefs as the cross-sectional standard deviation of recession probabilities for a given quarter across participants. The dispersion signal is then the change in this measure for the upcoming quarter, defined as:
Dispersion Signal: (Std(RECESS2) - Lagged Std(RECESS3)) > 0
The market timing strategy switches out of equities whenever the dispersion signal exceeds zero, that is when disagreement about the next quarter’s recession probabilities increases.
Following Sun (2025), I assume rebalancing occurs on the first day of the quarter after the SPF survey is released, and I include a transaction cost of 5 basis points. While Sun (2025) switches only into long positions in bonds or cash, I allocate to bonds based on the sign of the trailing six-month return of TLT. This allows the strategy to go long or short bonds during recession periods. The momentum overlay helps avoid long bond exposure during inflationary recessions when bonds tend to perform poorly. In this sense, bonds are not always a safe haven.
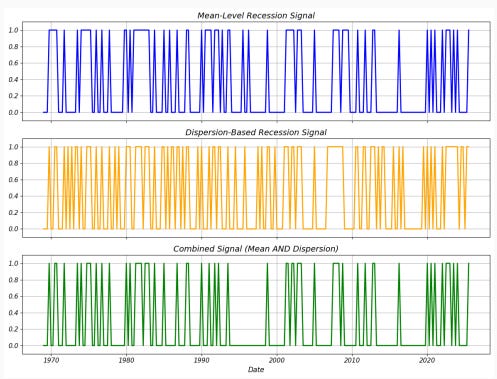
Below, I plot the recession and dispersion signals over time, along with a combined signal that activates only when both are true. A value of 1 indicates a switch out of equities and into bonds. Both signals are fairly active, particularly the dispersion signal. Combining them may help improve the signal-to-noise ratio.
I test the following three simple strategies, where the third requires both timing signals to be active:
Strategy 1: Switch between SPY and TLT based on the recession signal
Strategy 2: Switch between SPY and TLT based on the dispersion signal
Strategy 3: Switch between SPY and TLT when both the recession and dispersion signals are active
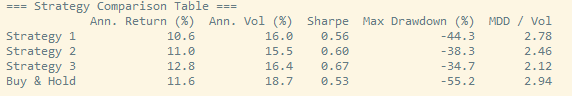
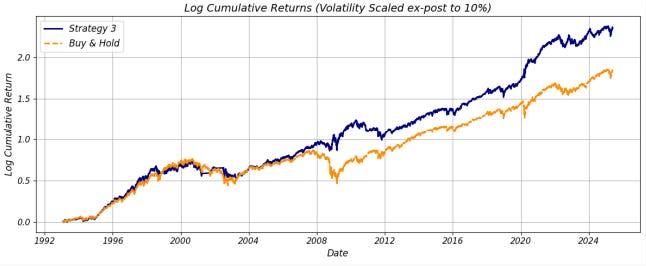
Backtesting these strategies shows that timing using either the level or the dispersion of recession probabilities independently improves Sharpe ratios and reduces drawdowns. The strategy based on recession beliefs alone achieves a Sharpe ratio of 0.56, while the dispersion-based strategy delivers a Sharpe of 0.60. Combining the two signals reduces noise and further improves performance, raising the Sharpe ratio to 0.67, about 25% higher than that of a buy-and-hold approach. The max drawdown-to-volatility ratio also improves significantly. The cumulative return plot reveals that the strategy’s outperformance relative to buy and hold is concentrated in the 2008–2009 financial crisis and the period beginning in 2020.
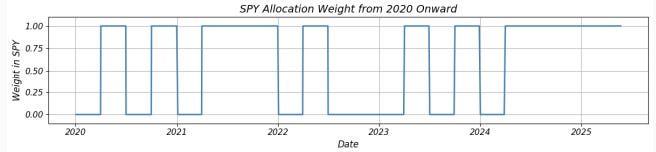
Zooming in on the SPY position since 2020, we see that the signal successfully avoided the equity market during the COVID crash in Q1 2020 and reentered on April 1, 2020. The model also remained out of equities for most of 2022.
Conclusions
Both prior research and my results suggest that survey-based recession beliefs are practically relevant for portfolio allocation. The level and dispersion of recession probabilities from the Survey of Professional Forecasters offer valuable early-warning signals for risk-off positioning. While each signal individually improves risk-adjusted returns relative to buy-and-hold, their combination delivers the most robust performance, enhancing Sharpe ratios by approximately 25% compared to buy-and-hold and significantly reducing drawdowns. The ability of these belief-based signals to anticipate market stress, particularly during periods such as the Global Financial Crisis and the COVID-19 shock, suggests that they might add value in dynamic asset allocation and serve as valuable inputs to systematic market timing strategies.
References
Beber, Alessandro, Michael W. Brandt, and Maurizio Luisi, 2015, Distilling the macroeconomic news flow, Journal of Financial Economics 117 (3), 489-507 (SSRN Working Paper 2220457).
Gomez-Cram, Roberto, 2022, Late to recessions: Stocks and the business cycle, Journal of Finance 77 (2), 923-966 (SSRN Working Paper 3671346).
Jain, Apurv, 2022, Alternative data and ML for macro nowcasting, SSRN Working Paper 4258444.
Kislitskiy, Ilya, Serhii Marinchenko, and Vitalii Veremiienko, 2025, Machine learning in GDP nowcasting: From lagging indicators to leading algorithms, SSRN Working Paper 5251604.
Sun, Yulong, 2025, Navigating economic downturns: Insights from survey-based recession indicators, SSRN Working Paper 5198217.
Disclaimer: This newsletter is for informational and educational purposes only and should not be construed as investment advice. The author does not endorse or recommend any specific securities or investments. While information is gathered from sources believed to be reliable, there is no guarantee of its accuracy, completeness, or correctness.
This content does not constitute personalized financial, legal, or investment advice and may not be suitable for your individual circumstances. Investing carries risks, and past performance does not guarantee future results. The author and affiliates may hold positions in securities discussed, and these holdings may change at any time without prior notification.
The author is not affiliated with, sponsored by, or endorsed by any of the companies, organizations, or entities mentioned in this newsletter. Any references to specific companies or entities are for informational purposes only.
The brief summaries and descriptions of research papers and articles provided in this newsletter should not be considered definitive or comprehensive representations of the original works. Readers are encouraged to refer to the original sources for complete and authoritative information.
This newsletter may contain links to external websites and resources. The inclusion of these links does not imply endorsement of the content, products, services, or views expressed on these third-party sites. The author is not responsible for the accuracy, legality, or content of external sites or for that of any subsequent links. Users access these links at their own risk.
The author assumes no liability for losses or damages arising from the use of this content. By accessing, reading, or using this newsletter, you acknowledge and agree to the terms outlined in this disclaimer.