
Trading the Fed: The Pre-FOMC Drift is Alive
Evidence, Strategy Performance, and the Role of Market Uncertainty

Introduction
The pre-FOMC announcement drift is a well-documented anomaly where equities exhibit abnormal positive returns leading up to Federal Open Market Committee (FOMC) meetings, challenging traditional asset pricing models. In this blog post, I test the anomaly using data through December 2024 and find that it remains persistent despite being published over a decade ago. The results confirm that the drift holds across different ETFs, with stronger effects in high-volatility environments. When applied to triple-leveraged ETFs, the strategy delivers an after-cost CAGR of 8–9% with a Sharpe ratio of about 0.6 while trading only 5% of the time.
Background
The impact of FOMC rate decisions on financial markets has been widely documented, particularly in their effects on equity and bond returns, as well as volatility dynamics. While the stock market’s response to unexpected interest rate changes is well understood, a growing body of research highlights a systematic return pattern in the days leading up to FOMC announcements.
A seminal study by Lucca and Moench (2015) documents the Pre-FOMC Announcement Drift, a persistent pattern where the S&P 500 exhibits significant positive excess returns in the 24-hour period before scheduled FOMC meetings. Since 1994, these pre-FOMC gains have accounted for over half of the total annual realized excess stock market returns, a striking finding given that no equivalent pattern is observed in bonds, currencies, or commodities. Notably, this drift does not reverse post-announcement, suggesting it is not driven by immediate information release, but rather by gradual investor positioning ahead of monetary policy decisions.
The pre-FOMC drift may, in part, reflect compensation for bearing macroeconomic risk. Savor and Wilson (2013) show that expected returns on scheduled macroeconomic announcement days, including FOMC meetings, are significantly higher than on other days, suggesting that investors demand a risk premium for holding assets through uncertain policy events. However, since the drift occurs before rather than after announcements, it differs from traditional macroeconomic risk premia. This raises questions about whether the pattern is driven by information asymmetry, risk-based factors, or investor behavioral biases.
Subsequent research has examined the robustness and evolution of the pre-FOMC effect. Cieslak, Morse, and Vissing-Jorgensen (2019) extend the analysis by showing that the FOMC indirectly influences stock returns over the full policy cycle, as investors adjust risk exposure in anticipation of Fed actions. More recent evidence suggests that the pre-FOMC drift is now concentrated around meetings that include a press conference, whereas meetings without press conferences no longer exhibit the same pattern (Lucca & Moench, 2018). This shift implies that investors increasingly focus on the communication component of monetary policy rather than just rate changes.
Another approach to understanding the FOMC drift focuses on quantifying the risk premium associated with FOMC meetings. Liu, Tang, and Zhou (2021) estimate the FOMC risk premium using option prices, finding that it is highly time-varying, averaging 45 basis points but ranging from 1 to 326 basis points between 1996 and 2019. Their study highlights that the premium is higher during periods of low consumption growth, low GDP growth, low inflation, or elevated market volatility (VIX). This suggests that the compensation investors demand for bearing FOMC-related uncertainty is dynamic and linked to broader economic conditions.
Overall, the literature provides compelling evidence of a positive price drift around FOMC meetings, generating abnormal returns in the days and hours leading up to announcements. I illustrate this effect below using 1-minute data on SPY from January 2014 to December 2024, measuring the price drift around scheduled FOMC meetings, all of which span two days. The figure below plots cumulative average returns over these periods.

It is evident that prices begin drifting upwards from the close of the day before the meeting and continue rising until the end of the final meeting day. The drift peaks and becomes more volatile during the latter part of the second day, aligning with the timing of the FOMC policy decision and the subsequent press conference by the Fed Chairman.
Strategy
Let’s now consider a trading strategy designed to capitalize on this pattern.
Data
I test the strategy using end-of-day data on SPY from its inception in January 1993 to December 2024, obtained from EODHD. I also report results for QQQ and the 3x leveraged ETFs SPXL and TQQQ. The analysis only includes scheduled Fed meetings, with earlier years in the sample primarily consisting of one-day meetings, while two-day meetings become more common in later years.
For excess return and Sharpe ratio calculations, I use the 3-month T-bill rate (DTB3) sourced from FRED, the Federal Reserve Bank of St. Louis.
Testing
To evaluate the effectiveness of this pattern, I construct a trading strategy that enters long at the close of the day before the FOMC meeting and exits at the close of the final meeting day. For two-day meetings, this means entering a long position the day before the first meeting day.
The strategy earns the risk-free rate while in cash, and I report results both with and without trading costs, assuming a one-way cost of 5 basis points.
SPY

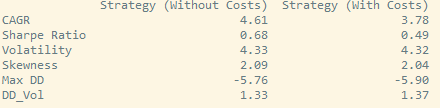
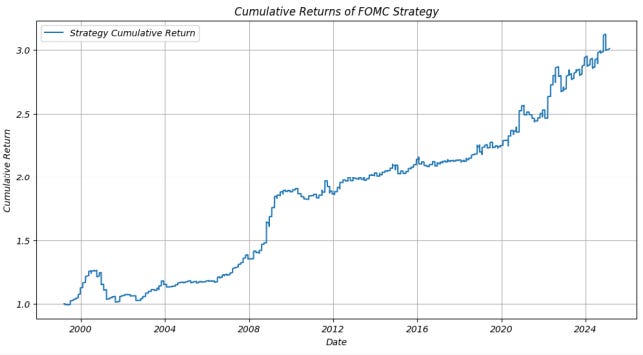
The strategy has generated a CAGR of approximately 4% per year with a Sharpe ratio of 0.5–0.6. Its low volatility is largely because it only trades on 5% of trading days, as the Fed typically holds eight meetings per year. Notably, the strategy has continued to perform well even after the studies mentioned above, though it experienced a flat period between 2016 and 2019 before gaining momentum again in recent years.
Testing whether strategy returns differ from returns on non-FOMC days, I find that the difference is strongly statistically significant, providing further evidence of a unique FOMC price drift.
To test whether the strategy can generate higher returns, I apply it to QQQ and the 3x leveraged ETFs TQQQ and SPXL, which amplify market movements.
QQQ

TQQQ


SPXL

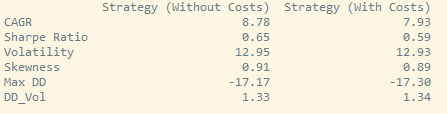
The strategy delivers a CAGR of 8–9% for triple-leveraged ETFs, despite trading on only 5% of days. After-cost Sharpe ratios are around 0.6, with maximum drawdowns of approximately 18% and a drawdown-to-volatility ratio of 1.3, making it attractive compared to many other strategies.
The Impact of Uncertainty
Previous studies have identified a positive relationship between the FOMC price drift and market uncertainty, suggesting that the drift is stronger during periods of high uncertainty. This supports the resolution of uncertainty hypothesis, which argues that investors demand a premium for bearing policy-related risk ahead of FOMC meetings, and returns adjust as uncertainty dissipates.
To test this, I examine the relationship between the VIX level at trade entry and the cumulative strategy return over the FOMC meeting period. I then divide VIX levels into quartiles and plot the average strategy return within each bucket.
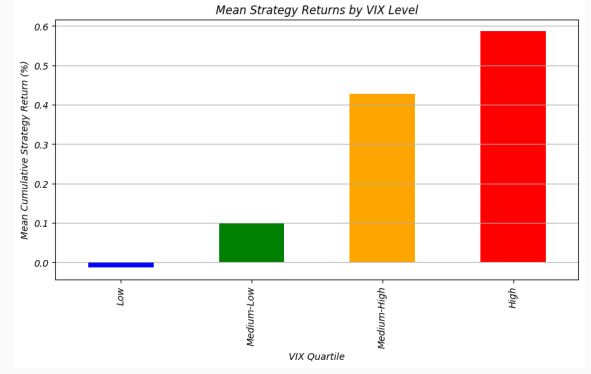
The pattern is significantly stronger during periods of high market volatility while remaining close to zero in low-volatility environments. This suggests that the strategy not only capitalizes on pre-FOMC price drift but also provides diversification benefits, particularly in periods of heightened market volatility when traditional equity strategies often struggle.
Conclusion
I find that the pre-FOMC price drift, first documented by Lucca and Moench (2015), remains persistent. The results hold across different ETFs, including SPY, QQQ, and leveraged ETFs such as TQQQ and SPXL. Notably, the strategy has continued to generate positive risk-adjusted returns in recent years, despite the effect being published over a decade ago. One of the most striking observations is the relationship between the strength of the drift and market uncertainty, as measured by the VIX. The drift and strategy returns are significantly stronger in high-volatility periods, supporting the resolution of uncertainty hypothesis. With the Fed’s increased reliance on forward guidance and communication, investors should recognize that FOMC press conferences now play a critical role in driving market movements.
The strategy presents a repeatable pattern that may appeal to investors, particularly those utilizing leveraged ETFs, which have generated a CAGR of approximately 9% despite only trading 5% of the time. Its strong performance in high-volatility environments suggests that it could provide diversification benefits for equity investors. This approach could be extended beyond FOMC meetings to other macroeconomic announcements and information-driven events, potentially increasing trading frequency and return opportunities across both U.S. and international markets.
References
Cieslak, Anna, Adair Morse, and Annette Vissing-Jorgensen, 2019, Stock returns over the FOMC cycle, Journal of Finance 74, 2201-2248.
Liu, Hong, Xiaoxiao Tang, and Guofu Zhou, 2022, Recovering the FOMC risk premium, Journal of Financial Economics 145, 45-68.
Lucca, David O., and Emanuel Moench, 2015, The pre-FOMC announcement drift, Journal of Finance 70, 329-371.
Lucca, David O., and Emanuel Moench, 2018, The pre-FOMC announcement drift: More recent evidence, Liberty Street Economics, Federal Reserve Bank of New York.
Savor, Pavel, and Mungo Wilson, 2013, How much do investors care about macroeconomic risk? Evidence from scheduled economic announcements, Journal of Financial and Quantitative Analysis 48, 343-375.
Disclaimer: This article is for informational and educational purposes only and should not be construed as investment advice. The author does not endorse any specific securities or investments mentioned. While information is gathered from sources believed to be reliable, there is no guarantee of its accuracy, completeness, or correctness.
This content does not offer personalized financial, legal, or investment advice and may not be suitable for your individual circumstances. Investing carries risks, and past performance does not guarantee future results. The author and affiliates may hold positions in securities discussed without prior notification.
The author is not affiliated with, sponsored by, or endorsed by any of the companies, organizations, or entities mentioned in this newsletter. Any references to specific companies or entities are for informational purposes only.
The brief summaries and descriptions of research papers and articles provided in this article are the author's own interpretations of the findings and content. These summaries should not be considered as definitive or comprehensive representations of the original works. Readers are encouraged to refer to the original sources for complete and authoritative information.
Hi, thank you for this great post. Can you tell me how it is possible that the Cumulative Return graphs have more jumps per year than there are FOMC meetings? Shouldnt the strategy just trade around FOMC meetings and flatline the other time? I'm a bit confused by that behavior.
So I see 1.7%, (-0.9%), 3.3%, 4.4%, (-0.3%) for 2019 to 2024 inclusive for Fed Day 1 & 2 as total SPY returns by year. (Note: I have excluded 2020). This exercise I did via pen and paper as it were! Ok....spreadsheet to be honest!