
What Works Below the 200-Day Moving Average?
Factor, Industry, and Asset Performance in Bear Markets

Given the recent market downturn, marked by the S&P 500 and the Nasdaq trading well below their 200-day moving averages, the familiar adage “Nothing good happens below the 200-day moving average” has once again gained traction in financial media. The 200-day simple moving average (200SMA) is among the most widely followed indicators of long-term market trends, and a sustained breach below this level is often seen as a signal of deteriorating market conditions. While equity markets underperform below their 200SMA by construction, the performance of other asset classes and investment strategies during such periods may be different. This naturally raises the question: Which assets and strategies, if any, can still deliver during equity bear markets?
In this article, I examine the behavior of a broad set of asset classes and investment strategies across bull and bear market regimes, as defined by the equity market’s position relative to its 200SMA. Using both daily and monthly data, I analyze how performance evolve across these regimes. The sample includes traditional assets such as gold, long-term Treasuries, and commodities, as well as industry portfolios, long-short equity factor strategies, and trend following strategies. The goal is to highlight which assets or strategies offer resilience during so-called “bad times”.
Content Overview
Equity Long-Short Factors
Industry Portfolios
Trend Following Strategies
Gold, Treasuries, USD, and More…
Equity Long-Short Factors
We begin by examining the bull and bear market performance of a broad set of U.S. equity long-short factors. All factors are dollar-neutral, presented gross of transaction costs, and cover the period from July 1963 to December 2024. The analysis draws on two distinct datasets.
First, I use the widely studied Fama-French factors, sourced from Kenneth French’s data library. To define market regimes, I use the market factor, which captures the value-weighted return of all CRSP stocks listed and incorporated in the U.S. A 10-month moving average is applied to classify bull and bear markets.
The following factors are included in the analysis:
SMB: Small Minus Big (size)
HML: High Minus Low (value)
RMW: Robust Minus Weak (profitability)
CMA: Conservative Minus Aggressive (investment)
MOM: 12-month Momentum (winner minus loser)
ST_Rev: 1-month Reversal (short-term)
LT_Rev: 60-month Reversal (long-term)
The chart below displays Sharpe ratios for each factor, separately for bull and bear markets.

It is evident that all equity factors, except for the size factor, deliver positive or even superior performance in bear markets relative to bull markets. The differences in Sharpe ratios are particularly striking for the investment, profitability, and value factors, all of which exhibit substantially higher risk-adjusted returns during downturns. Although these strategies are constructed to be dollar-neutral, they are not explicitly market-neutral. In practice, the portfolio construction methodology often results in negative market betas for many of these factors, contributing to their strong performance in adverse market environments.
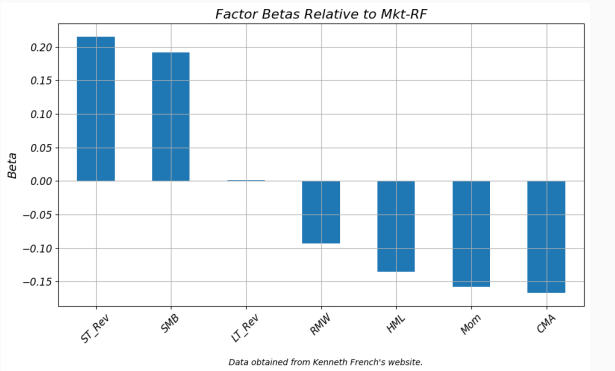
Among the factors, only the short-term reversal and size factors exhibit positive market betas, while the remaining factors tend to have zero or negative exposure to the market. As noted by Harvey et al. (2019), beta-neutral portfolio construction is more common in practice, and their findings suggest that such implementations often outperform dollar-neutral counterparts during bear markets. In particular, beta-neutral versions of profitability and quality factors have been shown to offer effective hedges against adverse market conditions. For a broad discussion on factor performance across different regimes, see Blitz (2023).
Next, I turn to the so-called JKP factors, introduced in the influential paper “Is There a Replication Crisis in Finance” by Jensen, Kelly, and Pedersen. The authors construct 153 long-short, dollar-neutral factors spanning 13 thematic categories and over 90 countries. For tractability, I focus on the U.S.-based theme portfolios, which are equal-weighted composites of the underlying factors within each thematic group. These factors are constructed at the monthly frequency using capped value-weighting and are designed to capture well-known anomalies across various dimensions of firm characteristics.
The themes include:
Accruals
Debt Issuance
Investment
Low Leverage
Low Risk
Momentum
Profit Growth
Profitability
Quality
Seasonality
Short-Term Reversal
Size
Value
Consistent with the previous analysis, bull and bear markets are defined based on the market’s position relative to its 200SMA. Again, I focus on Sharpe ratios for each theme across these regimes, using the same sample period as before: July 1963 to December 2024.

All but two of the factors deliver positive risk-adjusted returns during bear markets. For many themes, the contrast in Sharpe ratios across regimes is striking: factors such as low risk, value, investment, and profitability often exhibit flat or even negative performance in bull markets, yet generate strong returns when markets turn bearish. This asymmetric behavior underscores their potential role as defensive strategies. As with the previously discussed factors, most of these dollar-neutral portfolios exhibit negative market betas, as shown in the chart below.
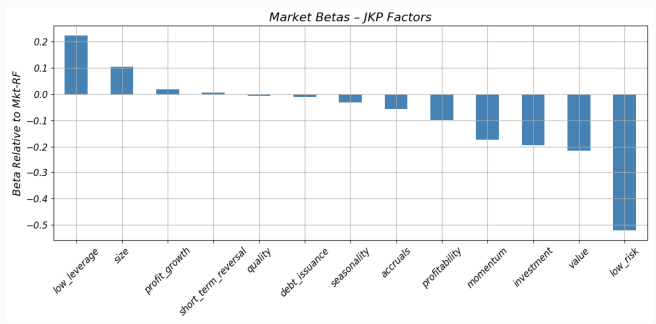
Only the low-leverage and size factors exhibit meaningfully positive market betas, and notably, these are also the factors that tend to underperform during bear markets. This pattern reinforces the earlier findings from the Fama-French factor set: The majority of long-short, dollar-neutral equity factors derive much of their performance during periods of market stress. Their negative or near-zero market exposure appears to provide resilience when broad equity markets decline.
Industry Portfolios
Next, I examine the performance of individual industry portfolios across bull and bear market regimes. The data is again sourced from Kenneth French’s website, which offers long-term returns for industry portfolios constructed using SIC codes, with varying levels of granularity, ranging from 5 to 49 industries. For this analysis, I focus on the 10-industry classification over the period from July 1963 to December 2024.
Since these are long-only portfolios, most industries naturally struggle during bear markets. However, there are meaningful differences in performance across sectors. Some industries prove far more resilient than others when equity markets decline. Let’s begin by analyzing their Sharpe ratios under bull and bear regimes.


Energy, utilities, and healthcare stocks have historically demonstrated greater resilience during bear markets compared to other sectors, while industries such as manufacturing, technology, and consumer durables have generally underperformed. The relative strength of energy stocks during downturns may appear counterintuitive given their cyclical characteristics. However, their performance is highly dependent on the nature of the bear market. In deflationary episodes, such as the 2008 financial crisis, energy stocks tend to suffer, whereas in inflationary bear markets, like in 2022, they often outperform as rising commodity prices bolster sector earnings.
With this in mind, let’s take a closer look at long-term industry performance using the most granular classification available: the 49-industry breakdown.


At a more granular level, gold stocks consistently stand out as the most resilient performers during bear markets. Interestingly, so-called "sin stocks", particularly those in the tobacco ("smoke") and defense ("guns") industries, also tend to outperform during periods of market stress. These sectors benefit from relatively inelastic demand and, in the case of defense, stable government-related revenue streams. Their earnings profiles are less tied to the broader economic cycle, which helps explain their historical strength when equity markets decline.
Trend Following
Trend-following strategies are well-regarded for their ability to perform strongly during bear markets, particularly when downturns are prolonged. To proxy for trend-following returns, I use data on time-series momentum (TSMOM) strategies provided by AQR. These strategies are based on 58 liquid futures contracts spanning four major asset classes, with positions determined by the sign of the past 12-month return and held for one month. As in the previous sections, I compare performance across bull and bear markets. For brevity, I focus on Sharpe ratios and visualize results for each asset class and the overall diversified TSMOM portfolio.

The combined trend-following portfolio exhibits slightly stronger performance during bear markets, though its overall results are relatively consistent across regimes, highlighting its low unconditional correlation to equities. Notably, the fixed income component stands out, with a Sharpe ratio about five times higher in bear markets compared to bull markets. In contrast, performance in currencies and commodities remains broadly stable across market regimes.
What’s particularly striking is the underperformance of the equity leg during bear markets. While trend-following in equities tends to work well in bull markets, it often struggles in downturns. This reflects the choppy and often short-lived nature of equity trends during bear markets, which are difficult to capture using medium- to long-term momentum signals. In contrast, fixed income typically exhibits smoother and more sustained trends during periods of market stress, making it the dominant contributor to trend-following returns in bad times.
This regime-dependent behavior is also reflected in the equity market betas presented below.

The combined trend-following portfolio exhibits an equity market beta close to zero, consistent with its largely uncorrelated return profile. However, this masks considerable variation across asset classes. The equity trend component displays a significantly positive market beta, reflecting its strong performance in rising equity markets. In contrast, the fixed-income trend component tends to thrive during market downturns, resulting in a negative equity beta. This highlights the asymmetric role of different asset classes within trend-following strategies, particularly the defensive characteristics of fixed-income trend signals in bear markets.
Gold, Treasuries, USD, and More…
To round out the analysis, I examine a more recent sample using daily data, with market regimes defined by the SPY ETF’s position relative to its 200-day moving average. The data, sourced from EODHD, covers the full available history for each ETF, ending in April 2025. The following ETFs are included in the analysis:
SPY – S&P 500 Index
GLD – Gold
USO – Crude Oil
TLT – 20+ Year U.S. Treasury Bonds
DBC – Broad Commodity Index
UUP – U.S. Dollar Index
TIP – Treasury Inflation-Protected Securities (TIPS)
BTAL – Dollar-neutral strategy: long low-beta stocks, short high-beta stocks
These ETFs span a diverse range of asset classes, offering exposure to equities, commodities, currencies, and fixed income. This allows for a broader evaluation of how different market segments behave across bull and bear regimes. Below, I plot Sharpe ratios of these assets to assess their resilience in downturns and sensitivity to equity market risk.
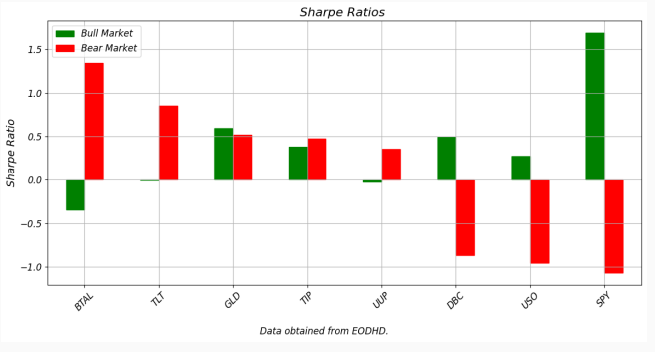
The results reveal that crude oil (USO) and broad commodity exposures (DBC) have significantly underperformed during equity bear markets, whereas gold and the anti-beta ETF BTAL have demonstrated notable resilience. Long-term U.S. Treasuries (TLT) have also tended to perform well in downturns; however, their hedging effectiveness is highly contingent on the macroeconomic backdrop. For instance, TLT posted strong gains during the deflationary bear market of 2008 but suffered steep losses in the inflationary environment of 2022. This highlights that Treasuries offer conditional protection, with their performance varying depending on the nature of the bear market.
BTAL, in particular, stands out for its consistent performance during equity drawdowns. Its behavior closely resembles that of the previously discussed dollar-neutral equity factor strategies, which typically exhibit negative market betas by construction. BTAL implements a systematic long/short approach by going long low-beta stocks and short high-beta stocks within sectors, effectively isolating exposure to the low-beta anomaly. Over the full sample period, the ETF’s market beta is approximately –0.4, reinforcing its role as a defensive asset and a potential hedge during periods of heightened market stress.
Conclusion
The old adage warns, “Nothing good happens below the 200-day moving average.” But as this analysis shows, that may be too simplistic. While equity markets indeed tend to struggle during these periods, a range of other assets and strategies have historically performed quite well.
Dollar-neutral equity factors with negative market betas, such as value, investment, and profitability, often shine in bear markets. Similarly, certain industry groups like gold miners, tobacco, and defense stocks demonstrate impressive resilience thanks to their stable demand and relative insulation from the business cycle. Trend-following strategies also perform well (at least in prolonged bear markets), especially in fixed income, where directional moves during downturns tend to be smoother and more persistent. Finally, asset-level exposures like gold, long Treasuries (in the right macro context), and low-beta strategies such as BTAL provide useful diversification benefits and downside protection.
To sum up, while broad equities underperform below the 200-day moving average, these regimes are precisely where alternative strategies and asset classes often begin to shine.
References
Blitz, David, 2023, The cross-section of factor returns, SSRN Working Paper 4441376.
Harvey, Campbell R., Edward Hoyle, Sandy Rattray, Matthew Sargaison, Dan Taylor, and Otto van Hemert, 2019, The best of strategies for the worst of times: Can portfolios be crisis proofed?, Journal of Portfolio Management 45 (5), 7-28 (SSRN Working Paper 3383173).
Jensen, Theis Ingerslev, Bryan Kelly, and Lasse Heje Pedersen, 2023, Is there a replication crisis in finance?, Journal of Finance 78 (5), 2465-2518.
Disclaimer: This newsletter is for informational and educational purposes only and should not be construed as investment advice. The author does not endorse or recommend any specific securities or investments. While information is gathered from sources believed to be reliable, there is no guarantee of its accuracy, completeness, or correctness.
This content does not constitute personalized financial, legal, or investment advice and may not be suitable for your individual circumstances. Investing carries risks, and past performance does not guarantee future results. The author and affiliates may hold positions in securities discussed, and these holdings may change at any time without prior notification.
The author is not affiliated with, sponsored by, or endorsed by any of the companies, organizations, or entities mentioned in this newsletter. Any references to specific companies or entities are for informational purposes only.
The brief summaries and descriptions of research papers and articles provided in this newsletter should not be considered definitive or comprehensive representations of the original works. Readers are encouraged to refer to the original sources for complete and authoritative information.
This newsletter may contain links to external websites and resources. The inclusion of these links does not imply endorsement of the content, products, services, or views expressed on these third-party sites. The author is not responsible for the accuracy, legality, or content of external sites or for that of any subsequent links. Users access these links at their own risk.
The author assumes no liability for losses or damages arising from the use of this content. By accessing, reading, or using this newsletter, you acknowledge and agree to the terms outlined in this disclaimer.