Linearity in Momentum: A Smarter Trend Signal for Asset Allocation
When Smoother Price Paths Make Momentum Stronger

Hi there,
A few readers have asked how performance in a tactical asset allocation (TAA) framework changes when we measure momentum differently than just past returns. Evidence suggests that the shape of the trend matters as much as the magnitude of the returns. A smoother, more linear price path like that of Stock1 below often delivers stronger continuation despite having the same return, and research backs this up.
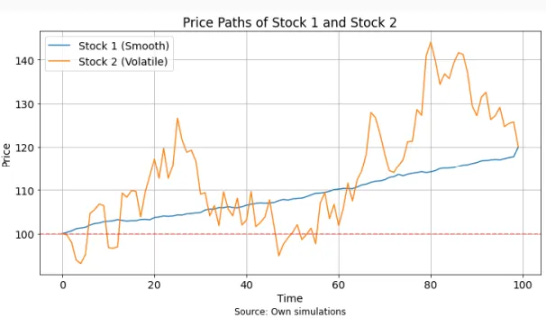
Cai et al. (2024) show that momentum profits rise with the linearity of past price moves, as captured by the R-squared from a simple time-trend regression. Between two assets with the same return, the one with the steadier path tends to outperform.
This lines up with what discretionary swing traders already know: Momentum and breakouts backed by clean, linear trends often have more follow-through, are easier to risk-manage, and may signal institutional accumulation.
In an earlier post, Momentum and Price Paths, I explored different trend measures in equity momentum. This week, I extend the idea to a multi-asset TAA framework, testing whether a regression-based trend score can improve rotation across asset classes (see Tactical Allocation 2.0: Lower Drawdowns, Higher Sharpe for a background of the framework).
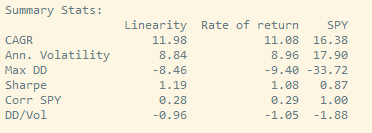
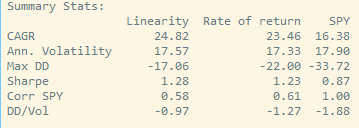
The improvements aren’t dramatic, but they are real and meaningful: Rewarding linear price trends raises CAGR and Sharpe ratios while reducing drawdowns. It’s exactly these incremental gains that, when stacked, compound into lasting performance.
Rotating into SPY
Rotating into SPXL
More on the signals and results below.
(As always, feel free to suggest research papers or strategy ideas you’d like me to cover. I often turn subscriber requests into future posts.)