

US stocks failed to follow their historical pre-midterm pattern. But a century of data suggests that the strongest part of the midterm cycle may still lie ahead.
In a previous article, I studied nearly a century of US stock market returns around November elections, from 1926 through 2025.
The analysis suggested an interesting pattern: Stocks have historically performed particularly well around midterm elections, with much of the outperformance occurring in the weeks leading up to Election Day. The difference was statistically significant, though only marginally.
Now that the 2026 midterms are behind us, we can revisit those findings, compare this year’s performance with the historical pattern, and extend the analysis to what typically happens over the following six months.
The Pre-Election Rally That Never Materialized
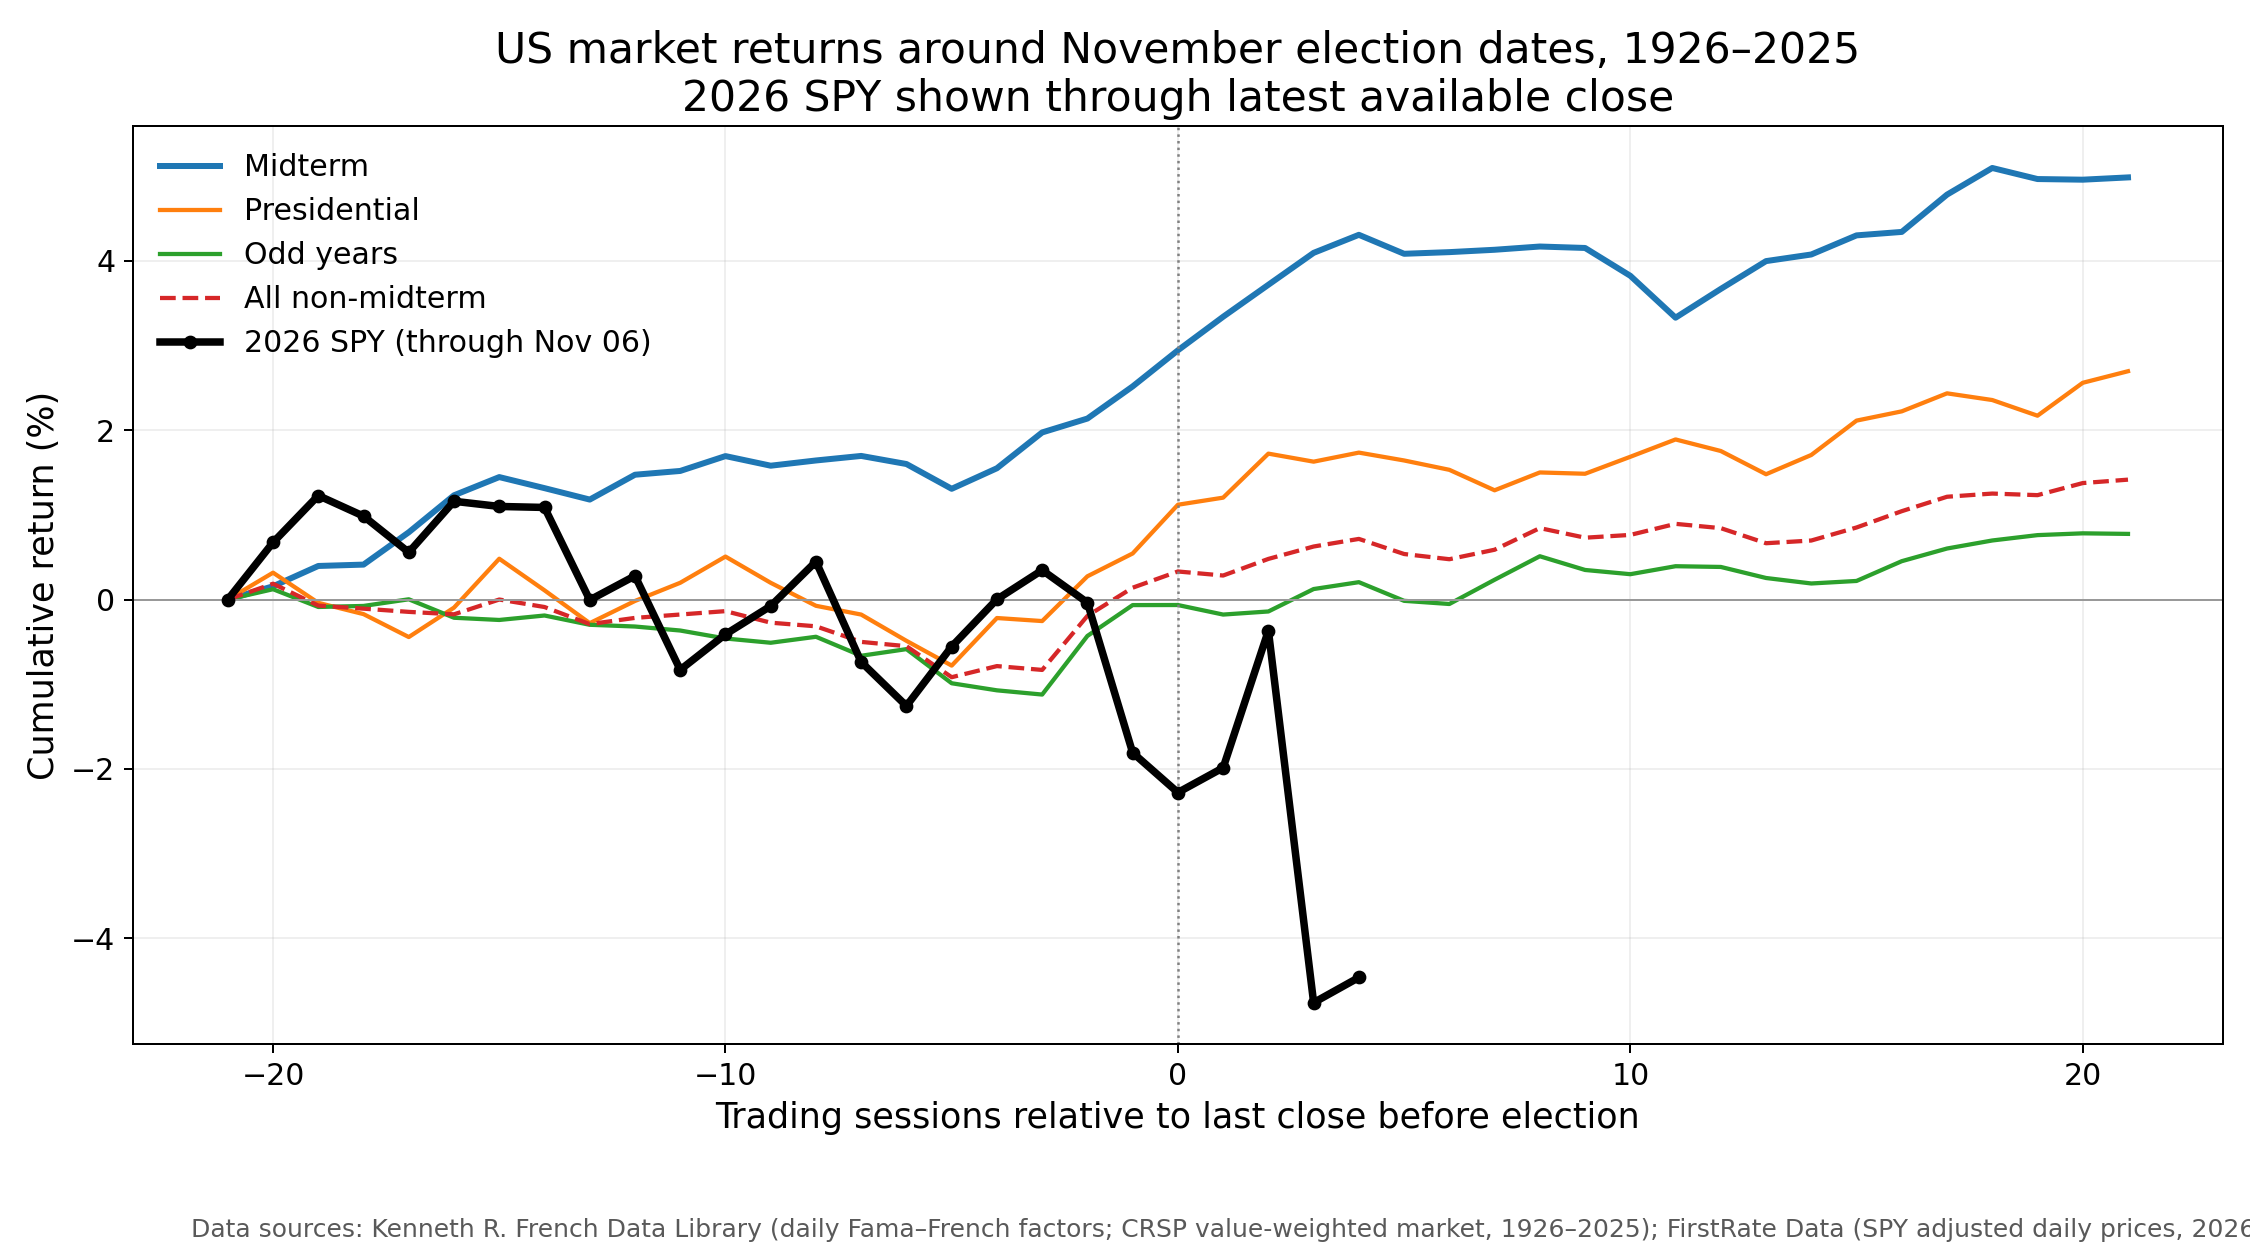
Historically, US stocks have gained an average of 3.0% during the 21 trading sessions leading up to midterm elections, compared with just 0.3% in other years.
The 2026 experience was quite different. Between October 2 and November 2, the SPY ETF declined 2.3%, underperforming the historical midterm average by approximately 5.3 percentage points.
The weakness continued immediately after the election. By November 6, SPY had fallen 4.5% from its October 2 close, compared with a historical midterm average gain of about 4.3% over the same period.
In other words, the 2026 market has so far moved in the opposite direction from the typical midterm pattern.
What Happens in the Six Months After Midterms?
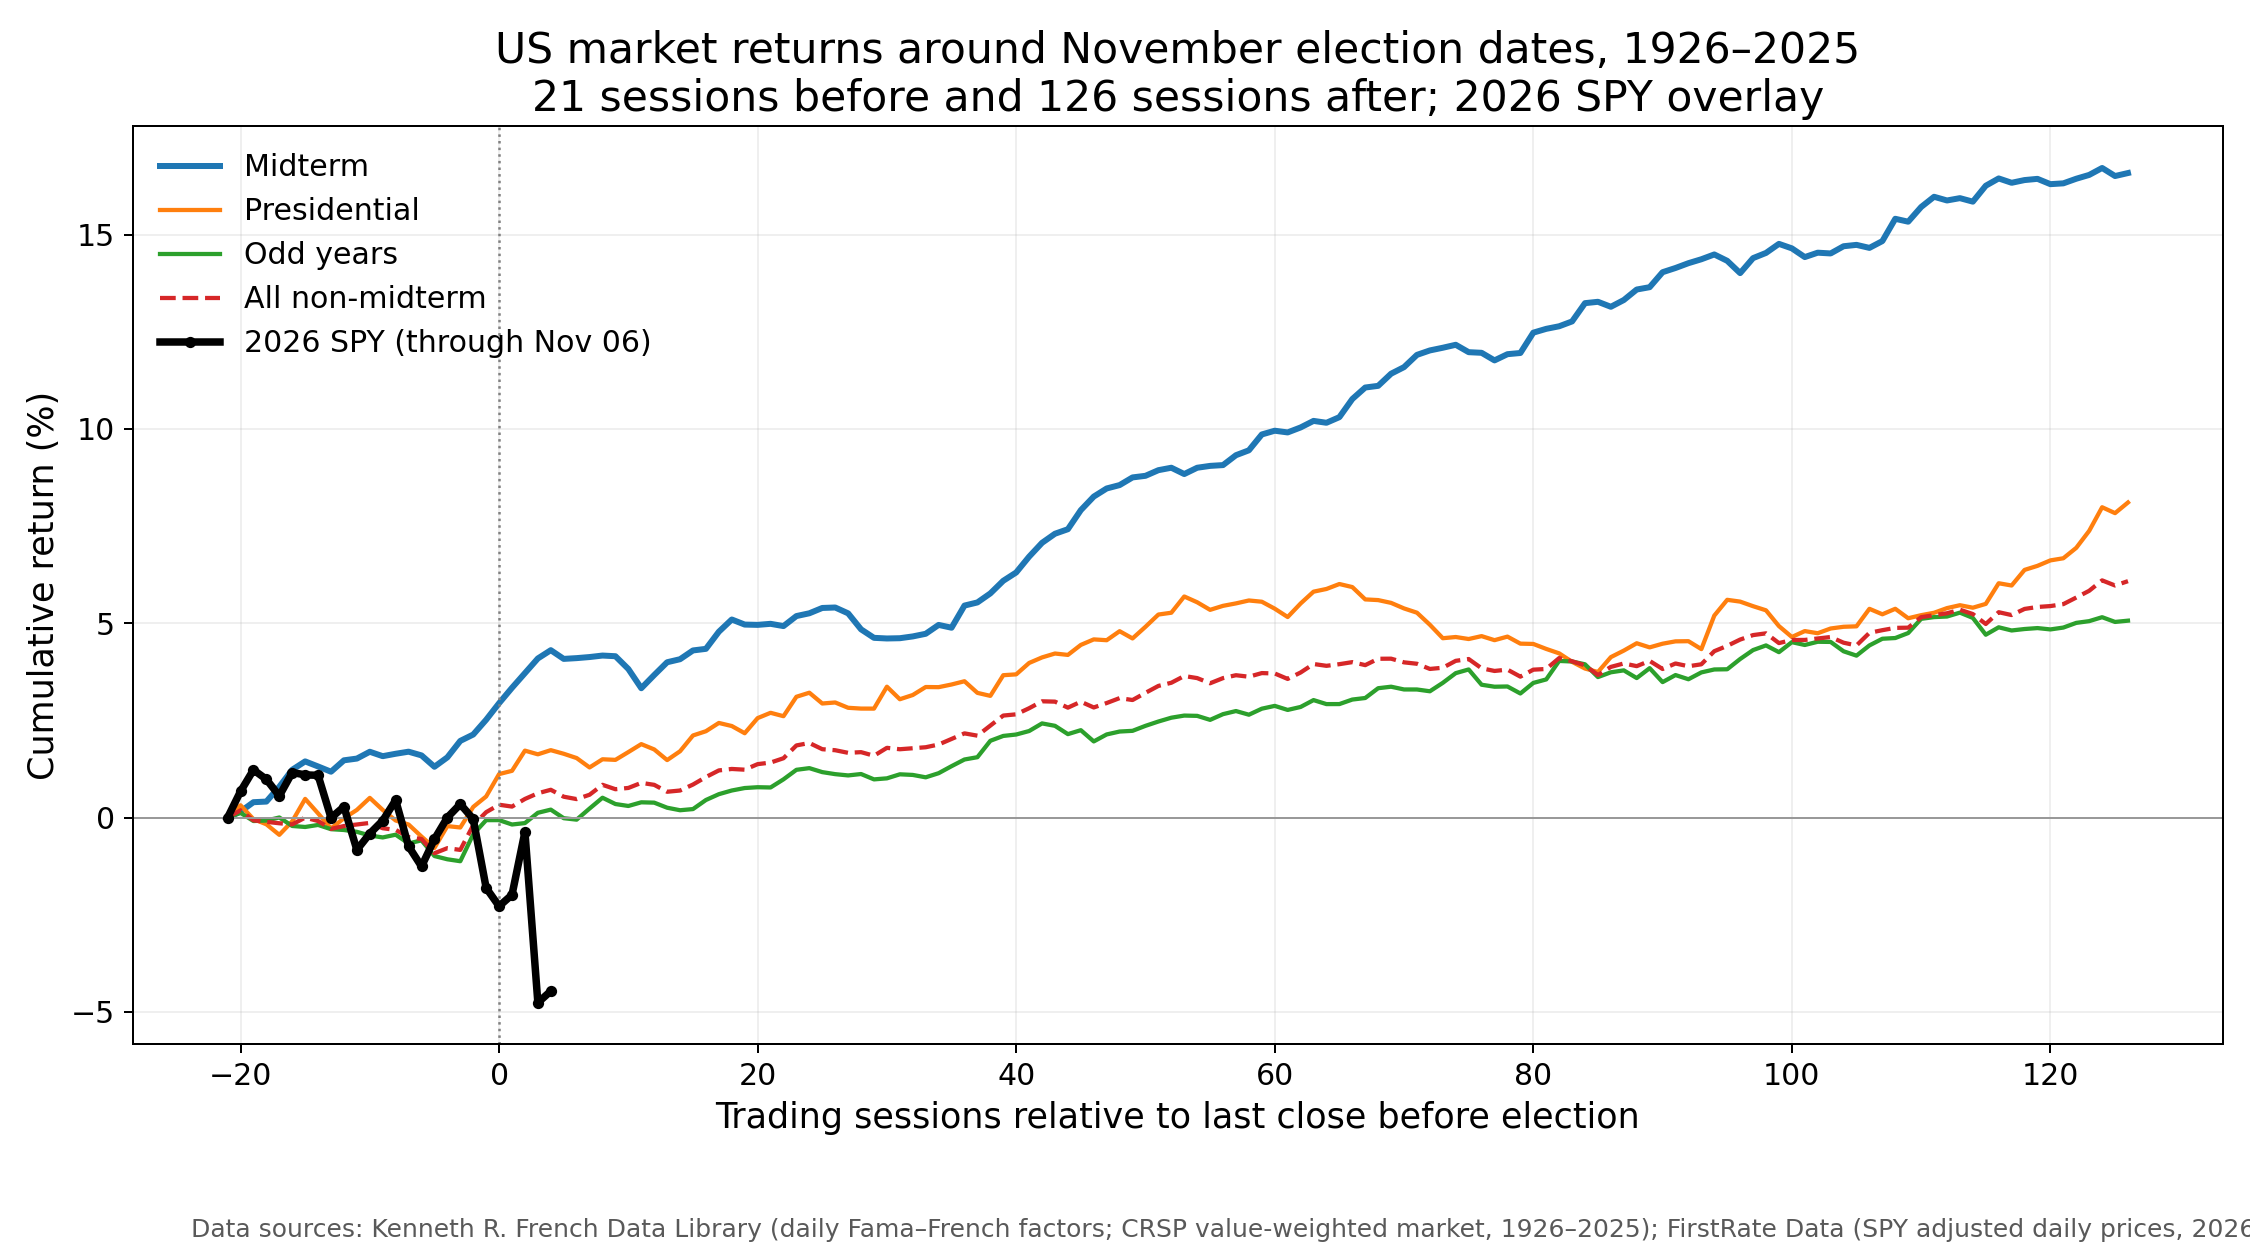
Our original analysis focused on the 21 trading sessions before and after Election Day. But what happens when we extend the post-election window to 126 trading sessions, approximately six months?
The historical results are considerably stronger over this longer horizon.

Across 25 midterm elections between 1926 and 2025, US stocks gained an average of 13.3% during the subsequent six months, compared with 5.6% in all other years.
That represents an outperformance of approximately 7.6 percentage points, statistically significant at the 1% level (Welch test, p = 0.0055). Post-midterm returns also exceeded those following presidential elections, with the difference significant at the 5% level.
Perhaps most notably, 22 of the 25 post-midterm periods delivered positive returns. All 19 midterm observations since 1950 were positive.
Does a Weak Pre-Election Market Change the Picture?
Given the disappointing performance leading into the 2026 election, an important question is whether the historical post-midterm rally depends on stocks having already performed well before Election Day.
Interestingly, seven of the previous 25 midterm elections were preceded by negative returns over the 21-session pre-election window.
In six of those seven cases, stocks subsequently gained over the following six months.
The average post-election return was 12.9% following negative pre-election periods, compared with 13.4% following positive ones.
Although the sample of seven observations is too small to draw strong statistical conclusions, the historical evidence suggests that a weak pre-election market has not necessarily prevented a subsequent rally.
What Does This Mean for 2026?
The 2026 midterm election has clearly not followed the historical script so far. The typical pre-election rally failed to materialize, and stocks continued to decline in the first few sessions after the vote.
However, the historical evidence suggests that the weeks immediately surrounding Election Day tell only part of the story.
Over the past century, the six months following midterm elections have delivered substantially stronger average returns than comparable periods in other years. Moreover, the pattern has generally persisted even when stocks declined before the election.
Whether 2026 will eventually follow that pattern remains to be seen. Historical averages are not forecasts, and election cycles are only one of many influences on stock returns.
Nevertheless, the evidence provides an interesting perspective: While the anticipated pre-midterm rally never arrived, the historically stronger post-midterm period has only just begun.
Methodology: Historical returns are calculated using the CRSP value-weighted US market portfolio, reconstructed from Kenneth French’s daily Fama–French factors, 1926–2025. Returns include dividends. Election Day is defined as the first Tuesday after the first Monday in November, with day 0 representing the preceding trading close. The 2026 comparison uses dividend- and split-adjusted SPY prices through November 6, 2026.
Disclaimer: This newsletter is for informational and educational purposes only and should not be construed as investment advice. The author does not endorse or recommend any specific securities or investments. While information is gathered from sources believed to be reliable, there is no guarantee of its accuracy, completeness, or correctness.
This content does not constitute personalized financial, legal, or investment advice and may not be suitable for your individual circumstances. Investing carries risks, and past performance does not guarantee future results. The author and affiliates may hold positions in securities discussed, and these holdings may change at any time without prior notification.
The author is not affiliated with, sponsored by, or endorsed by any of the companies, organizations, or entities mentioned in this newsletter. Any references to specific companies or entities are for informational purposes only.
The brief summaries and descriptions of research papers and articles provided in this newsletter should not be considered definitive or comprehensive representations of the original works. Readers are encouraged to refer to the original sources for complete and authoritative information.
This newsletter may contain links to external websites and resources. The inclusion of these links does not imply endorsement of the content, products, services, or views expressed on these third-party sites. The author is not responsible for the accuracy, legality, or content of external sites or for that of any subsequent links. Users access these links at their own risk.
The author assumes no liability for losses or damages arising from the use of this content. By accessing, reading, or using this newsletter, you acknowledge and agree to the terms outlined in this disclaimer.
Paid subscriptions may not be available in all jurisdictions and may change without notice.